The Retail Operations Metric Every CFO Should Track in 2026
Quick Answer
Revenue per operational hour is the single retail operations metric that most mid-market retailers don't track but should. It measures the revenue produced per hour of operational time across all functions — store staff hours, warehouse hours, head office support hours, customer service hours. Unlike revenue per employee (which excludes seasonal variation and store-vs-HQ differences) or labour-to-sale ratio (which only measures store labour), revenue per operational hour exposes hidden operational tax across the entire business. Mid-market retailers above ₹30 crore annual revenue should aim for ₹8,000-₹12,000 per operational hour as a baseline, with subsector variation. Tracking it requires a unified operational platform that merges POS, time-and-attendance, finance, and customer data into one source of truth.
Most retail CFOs track revenue, margin, and inventory turnover.
There's one number that exposes operational waste better than any of them — and almost nobody is tracking it.
Revenue per operational hour.
After working with mid-market retailers across India, the GCC, and the US, this is the single metric that most reliably surfaces hidden inefficiency before it shows up in margin compression. Here's why it matters, how to calculate it, and how to track it reliably.
Why Traditional Retail KPIs Miss the Operational Tax
Mid-market retail CFOs typically track:
- Revenue per employee — too coarse; doesn't account for seasonal hires or part-time variation
- Labour-to-sale ratio at store — only measures store labour; ignores warehouse, head office, customer service
- Inventory turnover — important but lagging; doesn't show ongoing operational efficiency
- Same-store sales growth — measures revenue growth, not efficiency
- Gross margin — measures pricing and cost discipline, not operational productivity
None of these capture the full operational tax — the gap between the revenue you're earning and the operational hours you're paying for to earn it. That gap is where mid-market retailers quietly bleed margin.
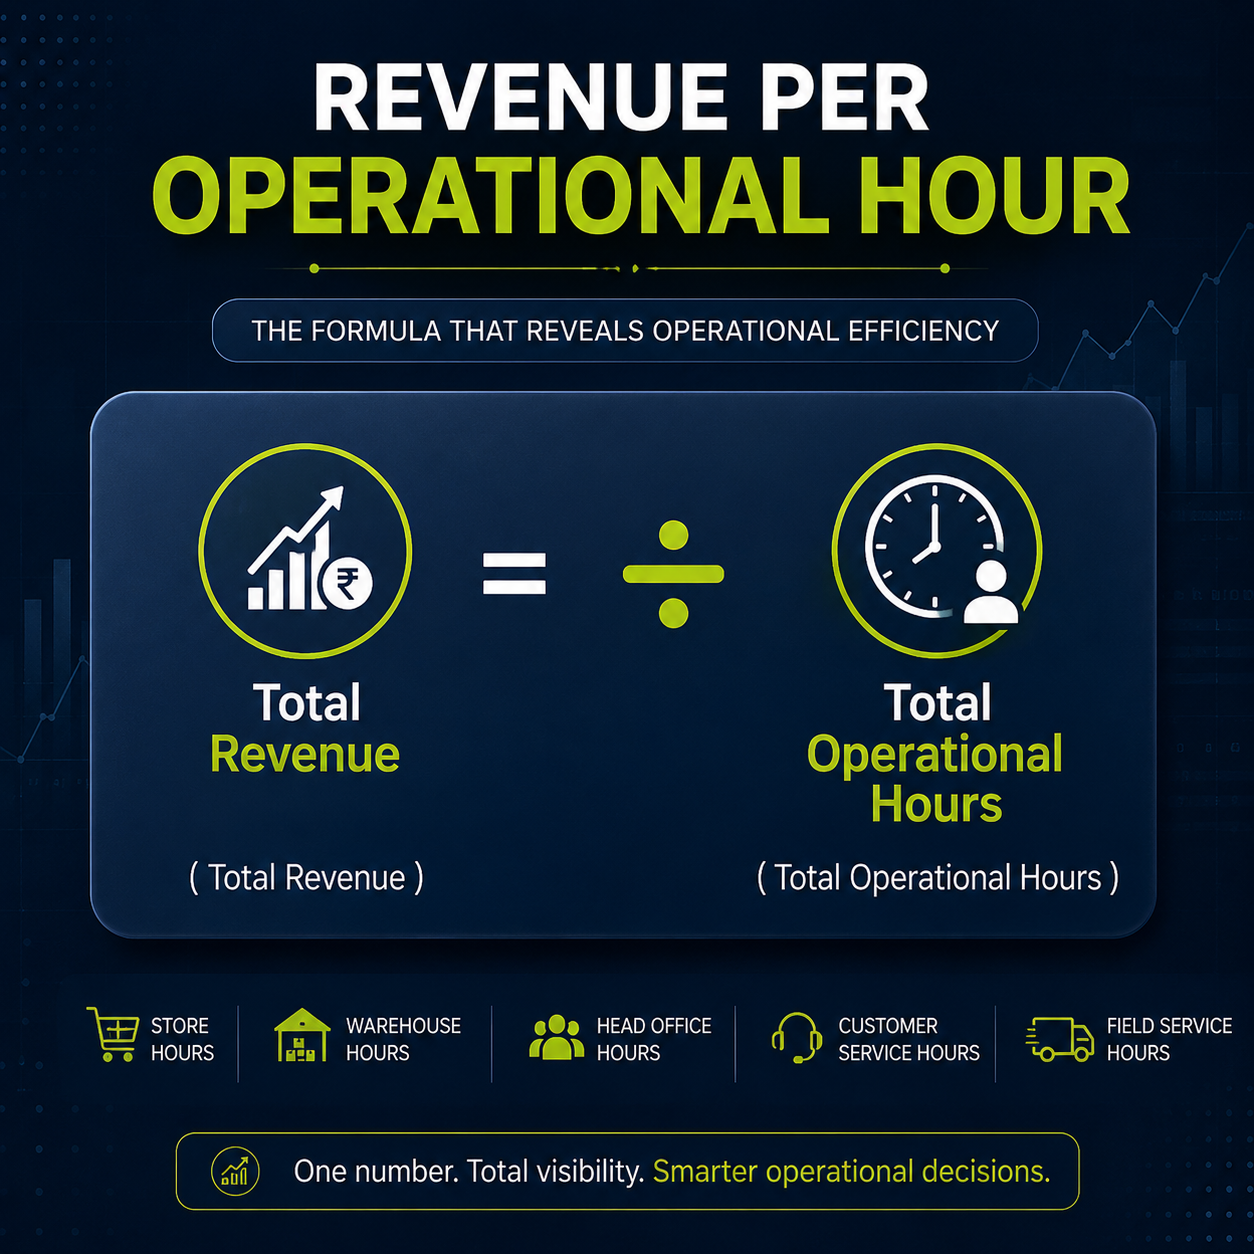
The Metric: Revenue Per Operational Hour
Revenue per operational hour is a single number:
(Total Revenue in Period) ÷ (Total Operational Hours Across All Functions in Period)
Operational hours includes:
- Store staff hours (counter, floor, manager)
- Warehouse hours (picking, packing, returns processing)
- Head office support hours (finance, HR, IT, marketing — apportioned to retail operations)
- Customer service hours (call centre, chat, email response)
- Field service hours (if applicable — for service-heavy retail)
It does NOT include:
- Executive time (already accounted for in different metrics)
- Strategic project hours (one-off, non-operational)
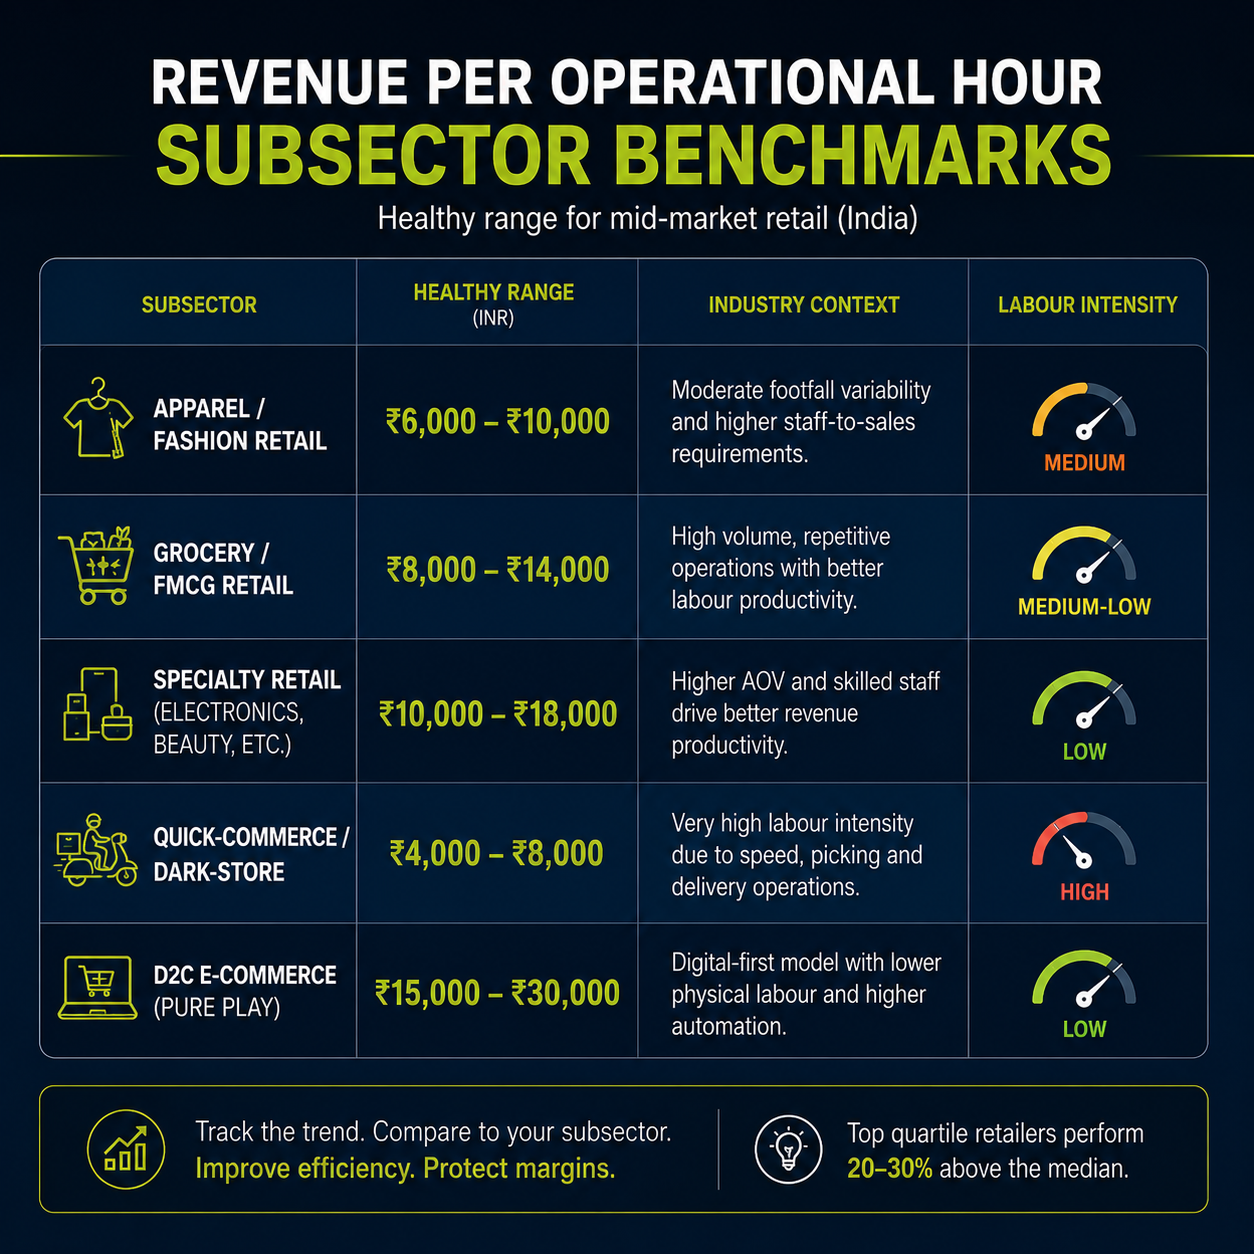
For a mid-market Indian retailer above ₹30 crore annual revenue, healthy revenue per operational hour ranges:
- Apparel / fashion retail: ₹6,000-₹10,000
- Grocery / FMCG retail: ₹8,000-₹14,000
- Specialty retail (electronics, beauty): ₹10,000-₹18,000
- Quick-commerce / dark-store: ₹4,000-₹8,000 (high labour intensity)
- Pure D2C e-commerce: ₹15,000-₹30,000 (lower physical labour)
Below the range for your subsector indicates operational tax. Above suggests either healthy efficiency or under-staffing that may compromise customer experience.
How to Calculate Revenue Per Operational Hour
The math is simple. The data plumbing is the hard part.
Step 1: Define the period. Weekly is recommended for operational decisions, monthly for executive review.
Step 2: Pull total revenue. From your POS + e-commerce platform + B2B order book if applicable.
Step 3: Pull total operational hours.
- Store staff: from time-and-attendance system or HRMS
- Warehouse: from warehouse management or HRMS
- Head office support: from HRMS, apportioned (typically 60-70% of total head office FTE hours)
- Customer service: from call centre / ticketing system
- Field service: from field service management system
Step 4: Divide. Revenue ÷ Hours = Revenue per operational hour.
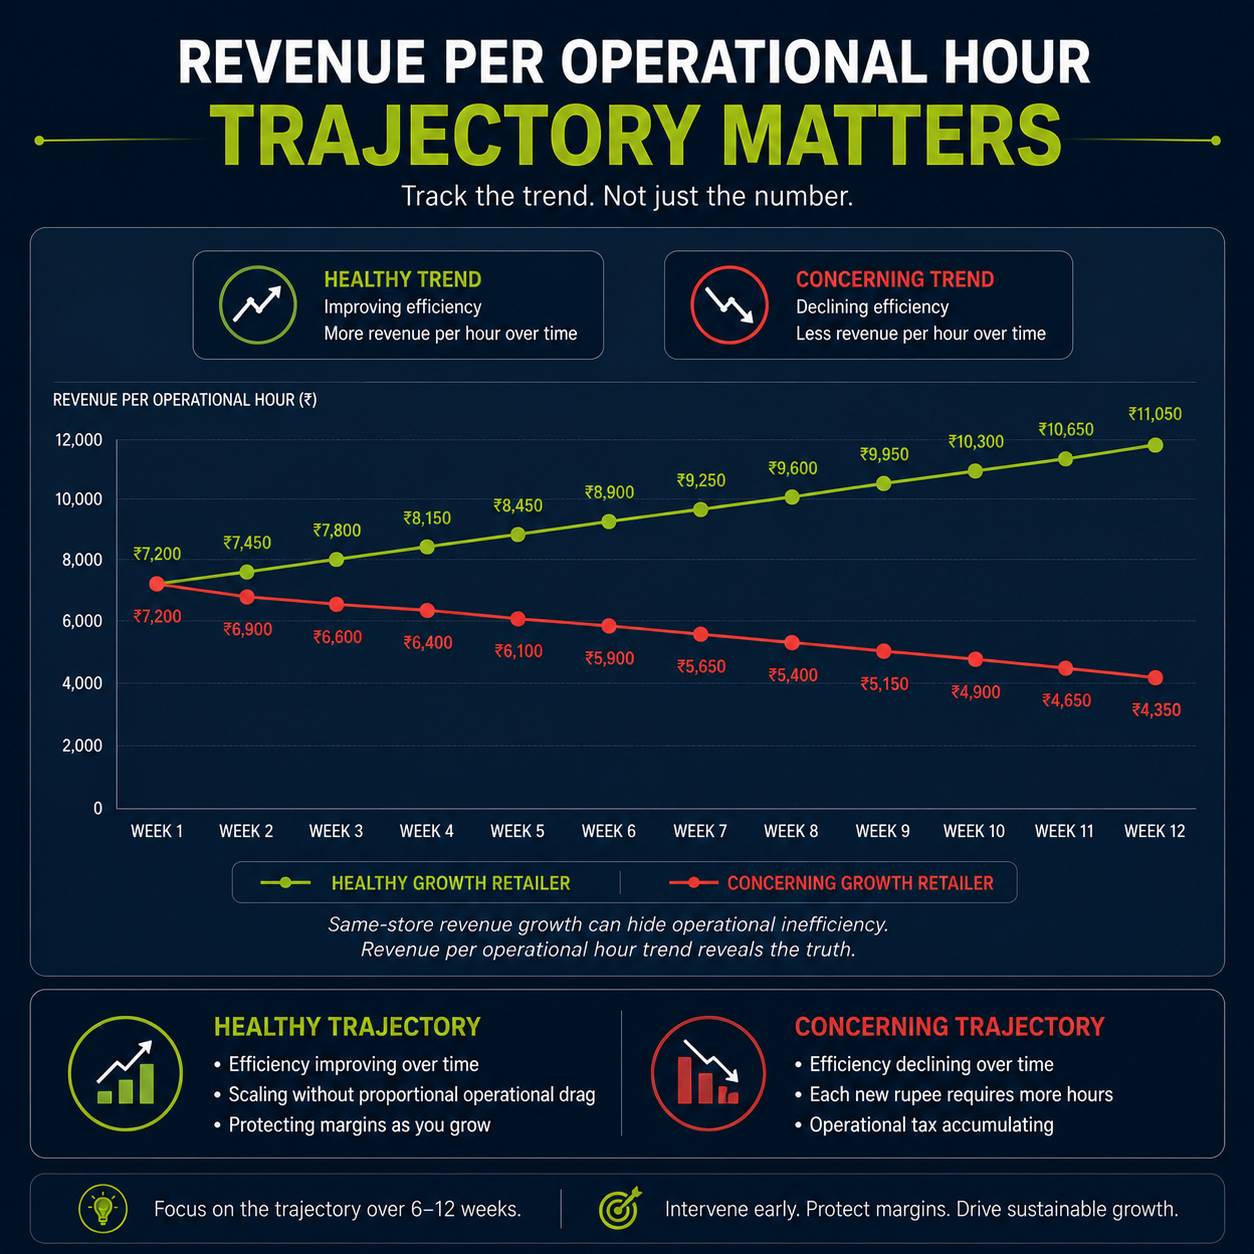
Step 5: Trend it. Track the number weekly. Watch the trajectory more than the absolute level. A declining trend over 6+ weeks signals operational tax accumulating; an improving trend signals operational discipline taking hold.
Step 6: Decompose it. Once the headline number is stable, break it down by store, by region, by channel. Surface the outliers. That's where management attention should focus.
What "Good" Looks Like by Retail Subsector
Beyond the absolute ranges above, the more useful benchmarks are:
- Top quartile mid-market retailers in any subsector run 20-30% above subsector median
- Bottom quartile run 25-40% below subsector median (operational tax >25% of revenue)
- Healthy growth retailers maintain or improve the metric while growing revenue — meaning they're scaling without proportional operational drag
- Concerning growth retailers see the metric decline as they grow — meaning each new rupee of revenue costs more operational hours to produce
The metric trajectory matters more than the level. A retailer at ₹6,000/operational hour improving 3% quarter-on-quarter is in better shape than one at ₹10,000/hour declining 5% quarter-on-quarter.
The Platform Layer Required to Track Revenue Per Operational Hour
Most mid-market retailers can't track this metric reliably because their data lives in disconnected systems:
- POS in Shopify / Lightspeed / Vyapar
- Time-and-attendance in Greythr / Keka / BambooHR
- Warehouse management in a custom system or Excel
- Customer service in Zoho Desk / Freshdesk
- Finance in Tally / ERPNext / QuickBooks
The CFO can produce the calculation manually once a month with 4-6 hours of Excel work. That's how most mid-market retailers do it today.
The platform shift: a unified operational layer that captures hours and revenue events from all source systems in real-time, calculates revenue per operational hour automatically, and surfaces the trend + decomposition on a live dashboard the CFO opens on a phone.
This is what mid-market retail custom platform builds in 2026 typically include — and what makes the metric actionable instead of theoretical.
FAQ: Retail Operations Efficiency Metric
What's a "good" revenue per operational hour for a mid-market Indian retailer?
Subsector varies: apparel ₹6,000-₹10,000, grocery ₹8,000-₹14,000, specialty ₹10,000-₹18,000, quick-commerce ₹4,000-₹8,000, D2C e-commerce ₹15,000-₹30,000. Trajectory matters more than absolute level — a 3% quarter-on-quarter improvement signals operational discipline tightening.
How often should the CFO measure this metric?
Weekly for operational decisions (which stores need attention, which regions are slipping), monthly for executive review (trend over time), quarterly for board reporting (year-on-year and subsector benchmarking).
What tools are needed to track revenue per operational hour reliably?
You need POS data, time-and-attendance data, warehouse hours, customer service hours, and head office FTE apportionment merged at a weekly level. Most mid-market retailers do this in Excel today (4-6 hours per month manual work). The scalable answer is a unified operational platform that calculates it automatically and updates a live dashboard.
Can a retail business outside India use this metric?
Yes — the calculation is currency-agnostic. The subsector benchmark ranges differ by country (US healthy apparel retail runs roughly $80-150 per operational hour; GCC healthy specialty retail runs AED 300-600). The metric mechanics and the platform requirement are identical.
Will AI agents change how this is measured in 2027?
Yes — AI agents will be able to predict revenue per operational hour for the next 7-14 days based on demand forecasts, weather, local events, marketing activity, and stockout risk. This shifts the metric from lagging (what happened) to leading (what will happen if we don't intervene). It requires the unified operational platform to already be in place — AI on fragmented data produces confident-sounding wrong predictions.
What To Do Next
For mid-market retail CFOs in 2026:
- Calculate revenue per operational hour for the last 3 months manually (one-off Excel exercise)
- Compare to the subsector benchmark range above
- Identify the gap and trace it back to specific stores / functions
- DM "RETAIL CFO" on LinkedIn for our 1-page retail efficiency benchmark PDF
Find your hidden operational tax before it hits your margins.