5 Retail KPIs Your Dashboards Are Getting Wrong Every Day
Quick Answer
Most retail dashboards are inaccurate by 11 AM every working day because POS, inventory, fulfilment, and finance systems operate as disconnected silos with 24-48 hour data lags between them. The five retail KPIs most commonly wrong on mid-market dashboards are: (1) real-time stockout rate, (2) true customer lifetime value, (3) returns-adjusted margin, (4) SKU velocity by store, and (5) labour-to-sale ratio. The fix is not a better BI tool — every retail business already has BI. The fix is a unified operational platform that captures data at the point of action, so the dashboard reflects what's true right now, not what was true yesterday at midnight.
Most retail dashboards are wrong by 11 AM every single day.
Founders make Tuesday afternoon decisions on Monday morning data. The competitor running same-day decisions has already won that revenue.
After 730+ enterprise software builds at Accucia, the pattern across mid-market retail businesses is consistent — and the fix isn't another BI tool. It's solving the data plumbing problem that makes every dashboard a lagging indicator.
These are the 5 KPIs we see broken on every mid-market retail dashboard, and the architectural shift that fixes all of them.
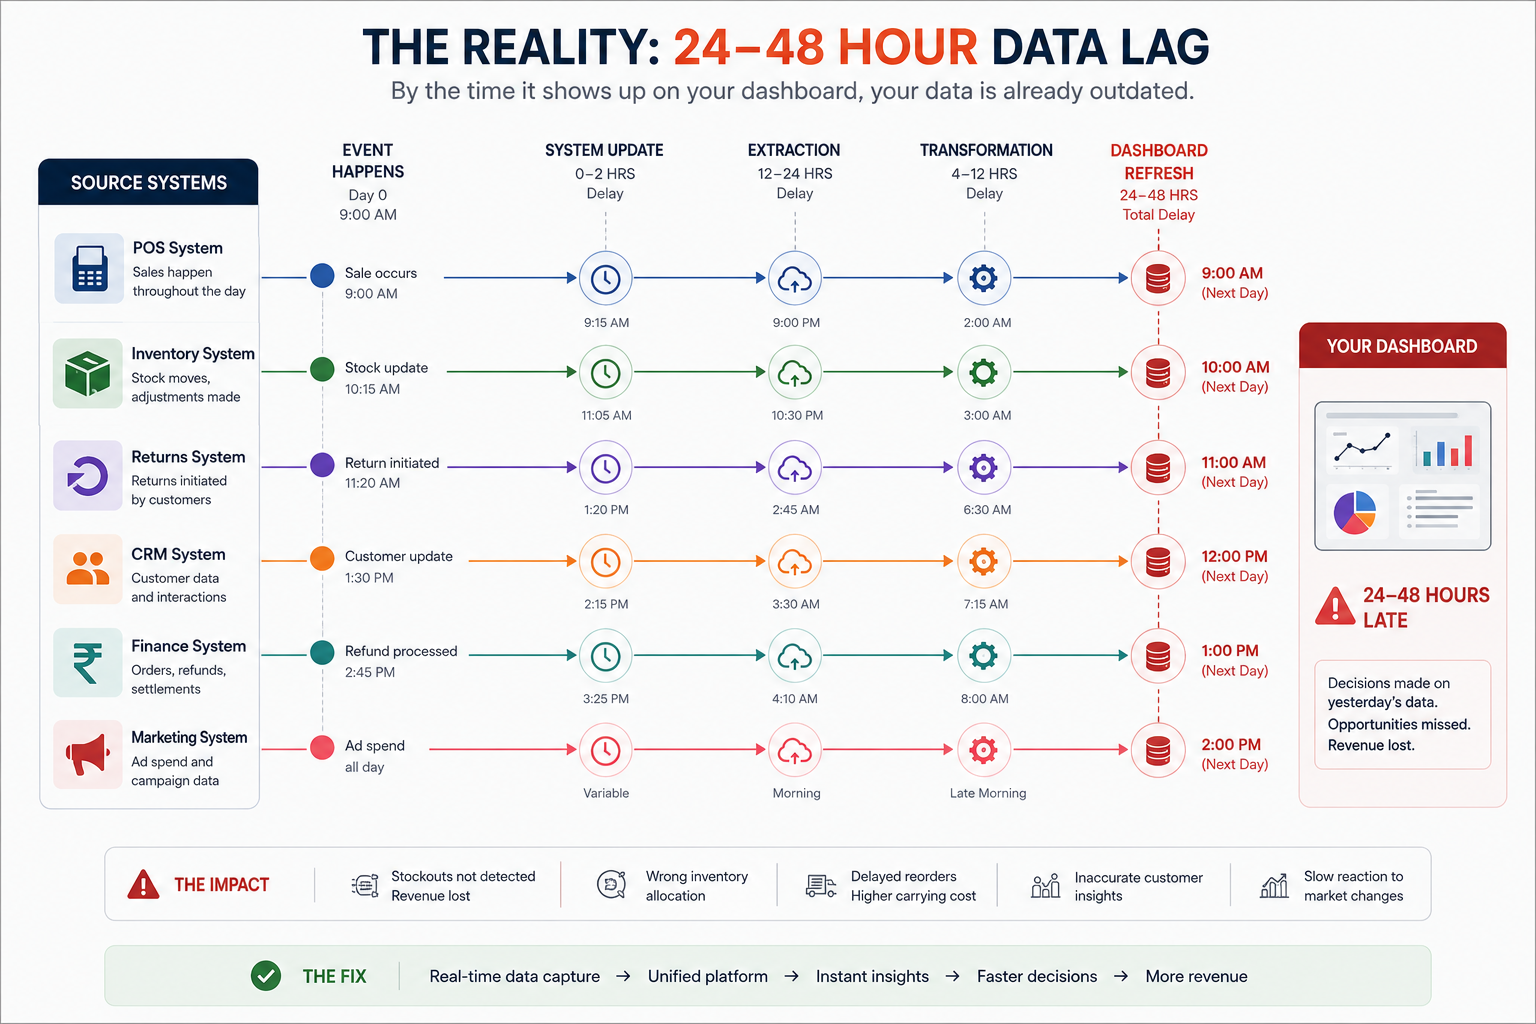
Why Retail Dashboards Are Wrong (Even Expensive Ones)
The root cause is the same across every mid-market retail business we've audited:
- POS data sits in one system (Shopify, Lightspeed, Vyapar, custom)
- Inventory data sits in another (warehouse management, sometimes Excel)
- Returns data sits in a third (sometimes manual)
- Customer data sits in a fourth (CRM)
- Finance data sits in a fifth (Tally, QuickBooks, ERPNext)
- Marketing spend data sits in a sixth
The "dashboard" is usually 4-6 reports stitched together by someone in Excel every Monday morning. By Tuesday at 11 AM, half the underlying source data has changed but the dashboard hasn't refreshed. By Thursday, the dashboard is openly fictional.
Every retail founder we talk to knows this is happening. Almost none have fixed it — because the fix isn't a BI tool, it's an operational platform architecture decision.
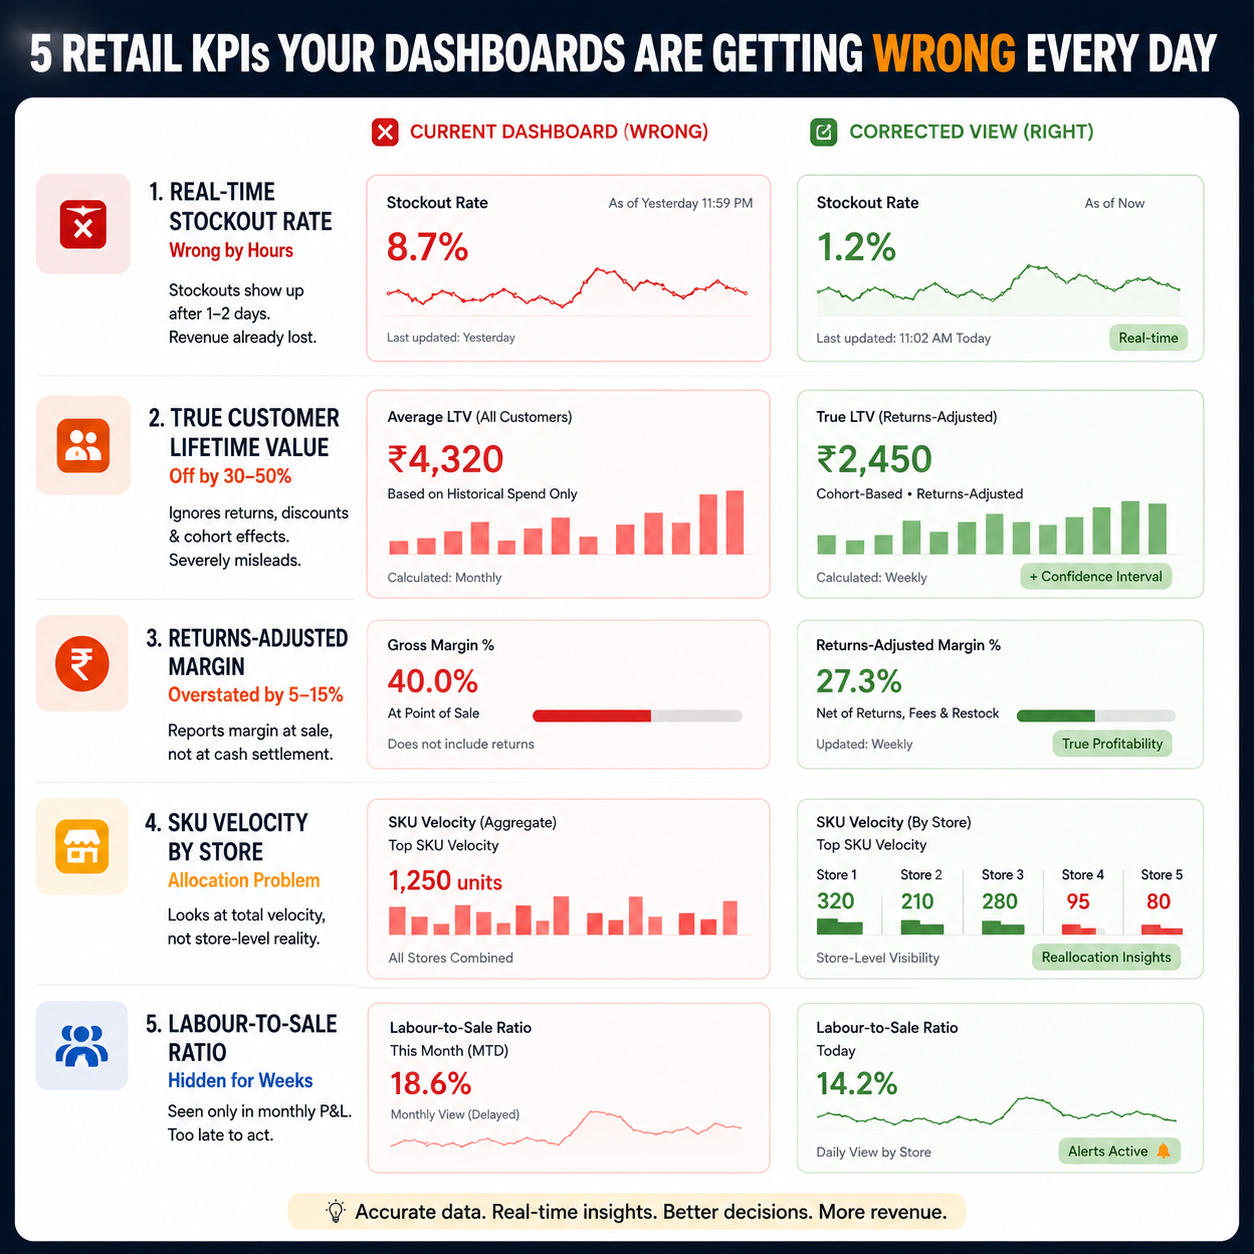
KPI 1: Real-Time Stockout Rate (Wrong by Hours)
A stockout that happens at 11 AM today shows up on most dashboards Wednesday morning — after the daily POS-to-inventory reconciliation runs overnight Tuesday.
By the time the founder sees the stockout, two days of revenue are lost. The customer who walked away has either bought from a competitor or set a price-alert for a different brand. Reorder triggers don't fire until the dashboard sees the stockout — which means re-stocking is delayed too.
What this should look like: stockout flagged within 5 minutes of the last unit selling. Reorder trigger fires automatically based on demand forecast for the next 7 days. Store manager gets a mobile push notification with the SKU, the predicted shortfall window, and the recommended reorder quantity.
The platform shift required: POS captures the sale event, inventory system listens to the same event stream in real-time, dashboard reflects the new state immediately. No nightly reconciliation. No Excel.
KPI 2: True Customer Lifetime Value (Off by 30-50%)
Most retail dashboards report customer LTV by averaging the historical spend of customers in a segment. The problem: that calculation excludes returns, doesn't account for cohort effects, and treats one-time bulk buyers the same as repeat customers.
In our retail engagements, the gap between "reported LTV" and "true LTV" is typically 30-50%. The customer segment the dashboard says is highest-value is often not the actual highest-value segment once returns, discounts, and cohort effects are factored in.
What this should look like: LTV calculated weekly per customer cohort, returns-adjusted, with a confidence interval. Top 10% customers identified for retention investment. Bottom 20% identified for either re-engagement or de-prioritisation.
The platform shift required: customer data + order data + returns data + fulfilment data in one unified table that updates in real-time. Not three CRMs and an Excel.
KPI 3: Returns-Adjusted Margin (The CFO Doesn't See It)
A retail business sells ₹100 of product at 40% gross margin. The dashboard reports ₹40 gross profit.
Three weeks later, the customer returns the product. Returns processing costs ₹15 (shipping, restock, customer service). The original ₹40 margin is now ₹25 — but the dashboard never updated.
Most retail dashboards report margin at the point of sale, not at the point of cash settlement. The CFO is making margin decisions on numbers that overstate profitability by 5-15% across the entire business.
What this should look like: margin calculated net of returns, restocking costs, refund fees, and merchant processing fees. Updated weekly. Trended by SKU, channel, and customer segment.
The platform shift required: returns data flows back into the margin calculation automatically. Not a separate Excel.
KPI 4: SKU Velocity by Store (The Allocation Problem)
A retail business with 8 stores typically has 200-2,000 SKUs. The dashboard shows aggregate SKU velocity — but the founder needs SKU velocity by store to allocate inventory correctly.
What we see: a SKU that's a top seller in 3 stores and a slow mover in 5 gets allocated evenly across all 8 because the aggregate dashboard says "this is a popular SKU." Three stores stock out; five stores accumulate dead inventory.
What this should look like: SKU velocity tracked per store, per week, with a re-allocation recommendation engine that surfaces "move 30 units from Store 5 to Store 2" suggestions every Monday.
The platform shift required: store-level data captured in real-time and analysed at the SKU+store granularity. Centralised dashboard with drill-down. Not a single aggregated KPI.
KPI 5: Labour-to-Sale Ratio (Hidden Until Quarterly Review)
Most retail businesses calculate labour-to-sale at the monthly P&L level. Which means the founder finds out a store is over-staffed for its actual sales volume 4-6 weeks after the problem started.
By then, two months of labour cost has been spent on a store that didn't need it.
What this should look like: labour-to-sale ratio calculated daily per store, with alert thresholds. Store managers get visibility into their own ratio. Regional managers see the comparison across their stores. Founder sees the outliers automatically.
The platform shift required: time-and-attendance data + POS data + finance data merged at the store level, daily. Most retail businesses have all three; almost none have them merged.
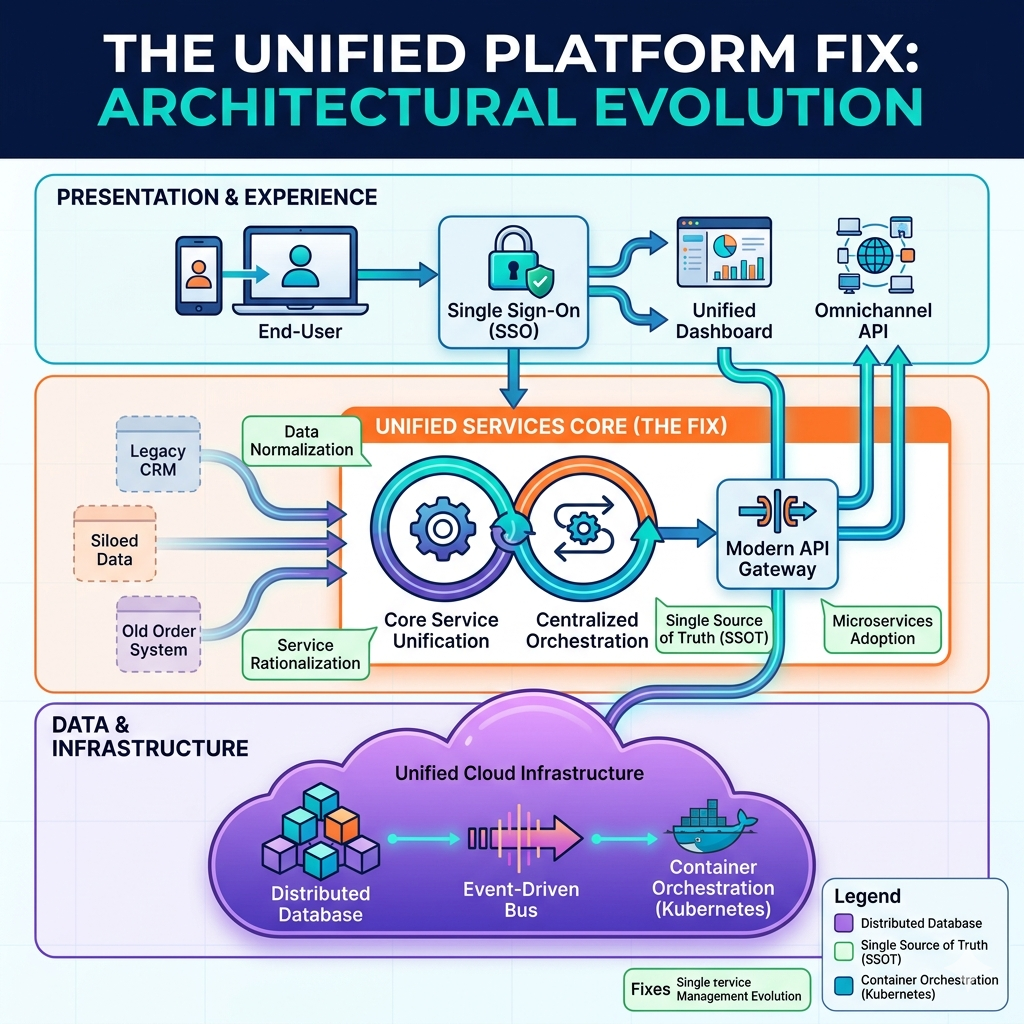
The Fix Is Not a Better BI Tool
Every retail business we audit has a BI tool. Tableau, Power BI, Looker, Metabase, or something else. The BI tool is fine. The problem is what's feeding it.
The architectural fix is a unified operational platform that captures data at the point of action — POS event, inventory update, return processed, customer interaction — and routes everything to a single source of truth that the BI tool reads from in real-time.
This is what custom platform development should mean for retail in 2026: not building another BI tool, but consolidating the 6-8 data sources behind it so the dashboard is finally accurate.
The 41% YoY growth in cloud ERP adoption in India is largely driven by mid-market retailers solving this exact problem. The cost has dropped 40-60% over 3 years; the capability is now production-grade; the timing is right.
FAQ: Retail KPIs and Dashboard Accuracy
How long does it take to build a unified retail platform that fixes all 5 KPIs?
Discovery + workflow mapping: 4-6 weeks. Build: 12-16 weeks. UAT: 2 weeks. On-site adoption support: 4-6 weeks. Total: 5-7 months. For a mid-market retailer with 5-25 stores, total first-year engagement runs ₹50 lakh to ₹1.2 crore.
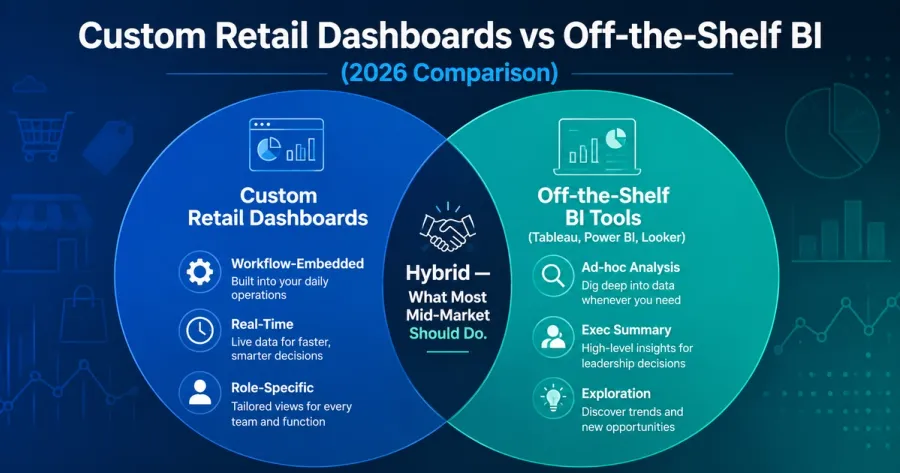
Should mid-market retailers build a unified platform or buy something like Shopify Plus?
Buy off-the-shelf if your operation is simple and matches Shopify Plus assumptions (DTC, single warehouse, standard returns, standard POS). Build custom if you have multi-location complexity, omnichannel returns flows, customer-specific pricing, or category-specific workflows that off-the-shelf can't match. Most mid-market retailers above ₹20 crore annual revenue benefit more from custom than off-the-shelf.
What about Shopify Plus or Lightspeed Retail — don't they solve this?
Partially. Off-the-shelf retail platforms solve the POS+inventory layer reasonably well for businesses that fit their assumptions. They don't solve the integration with finance (Tally / ERPNext / QuickBooks), the returns workflow, customer LTV calculation, or labour-to-sale ratios. For mid-market retailers with operational complexity, a custom layer above the off-the-shelf POS is usually the right answer.
How do I prove ROI before investing in a custom retail platform build?
Run a 2-week data audit first. Quantify the operational tax of the current dashboards being wrong: lost revenue from late stockout flags, dead inventory from bad allocation, over-staffing at specific stores, churn from misidentified customer segments. For most mid-market retailers we audit, the annual operational tax exceeds the cost of a custom build inside 12-18 months.
Will AI agents fix this in 2027?
No. AI agents need clean structured data to work. If your data is fragmented across 6 systems with 24-hour lags, the AI agent will produce confident-sounding wrong answers. The data plumbing has to be fixed first — then AI agents become a multiplier on top of an accurate operational layer.
What To Do Next
For mid-market retail founders in 2026:
- Run a 2-week data accuracy audit — pick one of the 5 KPIs and measure how wrong your current dashboard is
- Calculate the operational tax of the inaccuracy (lost revenue, dead inventory, over-staffing)
- DM "RETAIL DATA" on LinkedIn for our 9-question retail data audit framework
Ready for real-time retail insights?