Custom Retail Dashboards vs Off-the-Shelf BI (2026 Comparison)
Quick Answer
Custom retail dashboards beat off-the-shelf BI tools (Tableau, Power BI, Looker, Metabase) for three specific use cases: workflow-embedded decision support (where the dashboard triggers actions inside operational systems), real-time multi-source unified views (where data fragmentation defeats off-the-shelf reporting tools), and role-specific operational dashboards (where store managers, regional heads, and the CFO need different views of the same underlying data). Off-the-shelf BI tools still win for one-off analysis, executive-summary reporting, and data exploration. Most mid-market retailers benefit from a hybrid: a custom operational dashboard layer for daily decisions, plus an off-the-shelf BI tool for ad-hoc exploration.
Tableau. Power BI. Looker. Metabase.
Every mid-market retailer has one. Most are getting limited value from it.
The honest answer on custom vs off-the-shelf BI for retail isn't "always build custom" — that's vendor-speak. It's also not "always buy off-the-shelf" — that's outdated. The actual answer is a decision framework that depends on what you're trying to do with the data.
Here's that framework, with examples from 730+ Accucia builds across mid-market retail.
The Off-the-Shelf BI Promise (And Where It Actually Works)
Off-the-shelf BI tools — Tableau, Power BI, Looker, Metabase — sell on three promises:
- Connect any data source and visualise it
- Self-service analytics so business users don't need engineering
- Enterprise-grade governance with role-based dashboards
For specific use cases, these promises deliver:
- Ad-hoc analytical questions — "show me revenue by region by quarter for the last 3 years" — Tableau does this brilliantly
- Executive summary reporting — monthly board decks where the CEO needs 6 charts at a high level
- Data exploration — finding patterns and outliers in a structured dataset
- Cross-functional reporting where different teams need different cuts of the same data
For these use cases, off-the-shelf BI is the right answer. Building custom would be reinventing the wheel badly.
Where Custom Dashboards Beat Off-the-Shelf BI for Retail
For three specific use cases, custom dashboards consistently outperform off-the-shelf BI:
1. Workflow-Embedded Decision Support
Off-the-shelf BI tools show you data. Custom dashboards trigger actions.
A store manager seeing "SKU 247 is low stock at 14 units" in Tableau then has to open the inventory system, find the SKU, click reorder, fill in the quantity. Five clicks across two systems.
A custom dashboard sees "SKU 247 is low stock at 14 units below the 7-day demand forecast" and surfaces a one-click "Reorder 100 units from Warehouse 2" button — which the manager clicks once and the order is placed.
For operational decisions made dozens of times per day, this workflow integration matters more than visualisation polish. Off-the-shelf BI can't deliver it without significant custom development on top — at which point you've built a custom dashboard anyway, just with Tableau as the rendering layer.
2. Real-Time Multi-Source Unified Views
Off-the-shelf BI tools work brilliantly when the data is already in a clean data warehouse.
For mid-market retailers whose data lives in 6-8 separate systems (POS, inventory, warehouse, returns, CRM, finance) with no data warehouse, getting all the data into Tableau requires building a data integration layer first. That integration layer is where the cost and complexity live.
Custom dashboards skip the data warehouse step by reading directly from the operational systems via API or event stream. The dashboard is part of the operational platform, not a separate analytical layer that needs to be fed by ETL pipelines.
For mid-market retailers below ₹100 crore annual revenue, the data warehouse investment is often disproportionate. The custom dashboard layer integrated with operational systems is more cost-effective and produces real-time accuracy that ETL-fed Tableau can't.
3. Role-Specific Operational Dashboards
A retail business needs different dashboards for:
- Store managers — daily sales, stockout alerts, labour-to-sale ratio, customer feedback
- Regional heads — comparative store performance, allocation issues, regional trends
- Operations head — warehouse efficiency, fulfilment SLAs, supply chain bottlenecks
- CFO — margin trends, cash flow, working capital
- Marketing head — campaign performance, customer acquisition cost, LTV by cohort
- Founder — the 5-7 leading indicators that signal whether the business is on or off plan
Off-the-shelf BI tools can produce all of these — but typically as separate Tableau workbooks that someone has to maintain. The role-specific operational logic (which threshold triggers an alert, what action button to surface, what comparison view is most useful) has to be configured per role.
Custom dashboards bake the role logic into the platform. Each role sees their dashboard with their actions, their alerts, their decision support — without configuration overhead.
Where Off-the-Shelf BI Still Wins
For these use cases, off-the-shelf BI is still the right answer:
- One-off analytical questions that don't justify dashboard real estate
- Executive-summary reporting where the audience doesn't need real-time
- Cross-functional data exploration where different analysts need different cuts
- Static historical reporting (monthly P&L, quarterly board pack) that doesn't need real-time
- Low data volume use cases where building custom is overkill
The mistake mid-market retailers make is using off-the-shelf BI for everything, including the operational decision support use cases where it underperforms.
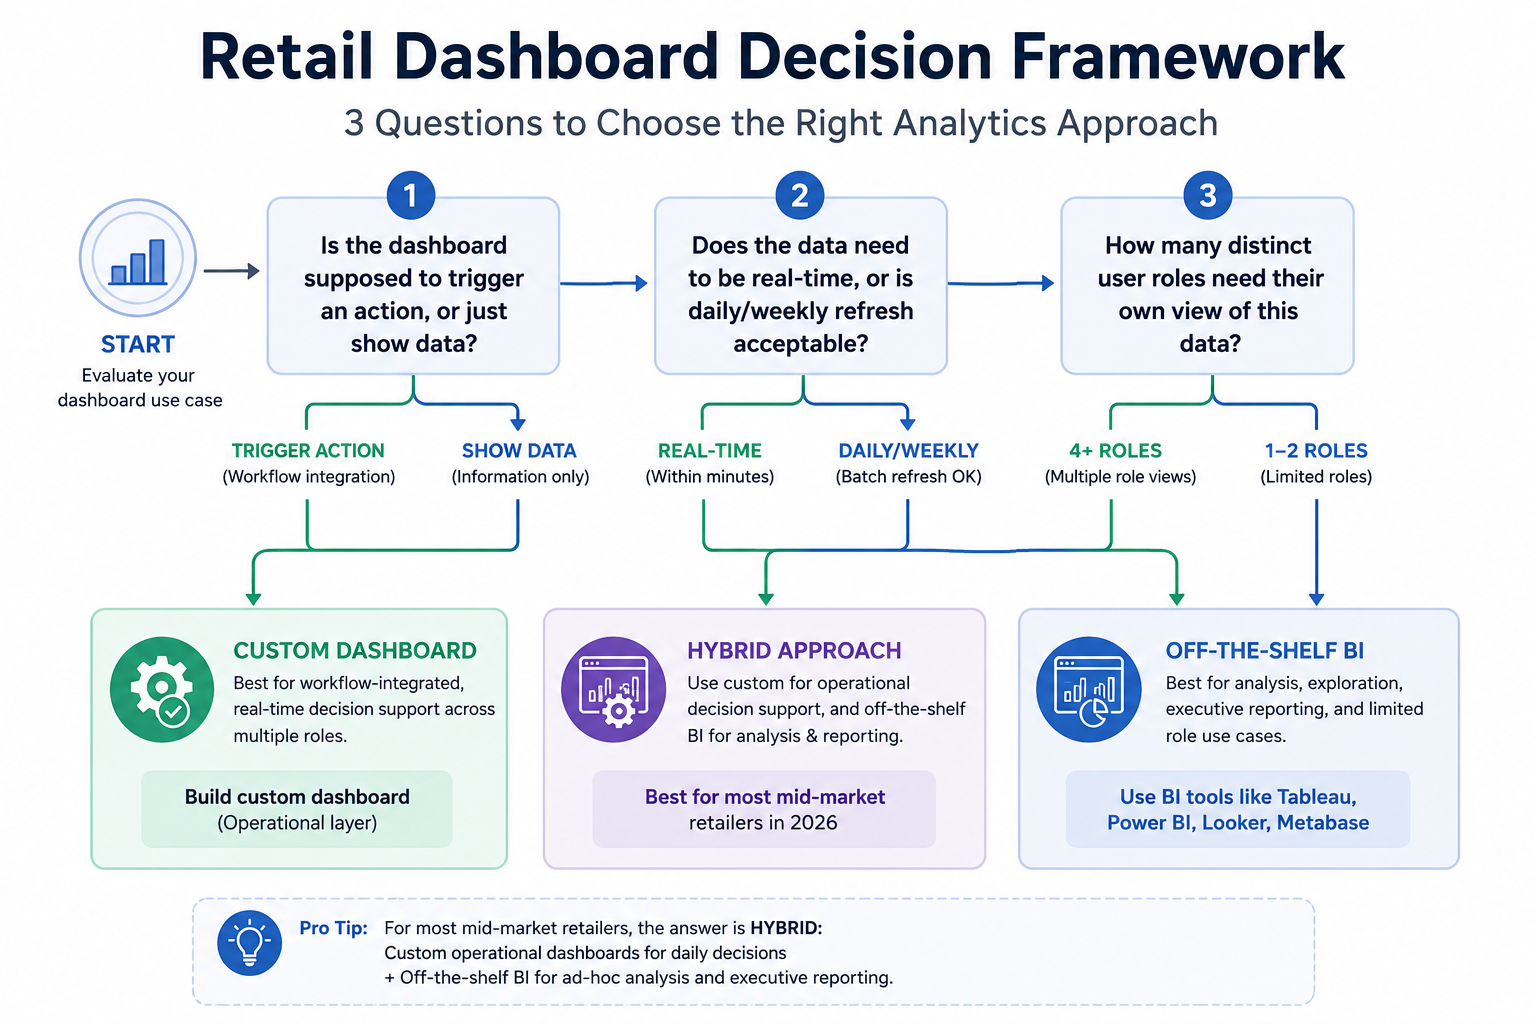
The Decision Framework (3 Questions)
Before deciding between custom dashboard or off-the-shelf BI for any specific use case, ask three questions:
Question 1: Is the dashboard supposed to trigger an action, or just show data?
- Trigger action → custom (workflow integration)
- Show data → off-the-shelf BI
Question 2: Does the data need to be real-time, or is daily/weekly refresh acceptable?
- Real-time (within minutes) → custom (read directly from operational systems)
- Daily/weekly → off-the-shelf BI (fed by overnight ETL)
Question 3: How many distinct user roles need their own view of this data?
- 1-2 roles → off-the-shelf BI (build a workbook per role)
- 4+ roles → custom (bake role logic into platform)
For most mid-market retailers, the answer is hybrid:
- Custom operational dashboard layer for daily decision support across 4-6 roles
- Off-the-shelf BI (Tableau, Power BI) for one-off analysis and executive reporting
This is the typical 2026 architecture we recommend for mid-market retail clients above ₹30 crore annual revenue.
What This Costs for a Mid-Market Retailer
A typical hybrid build for a 8-30 store retailer with ₹50-150 crore annual revenue:
- Custom operational dashboard layer (built on top of unified operational platform): ₹15-30 lakh
- Off-the-shelf BI license (Power BI Pro for 10-20 users): ₹3-6 lakh per year
- Initial data integration work (connecting both layers to operational systems): ₹8-15 lakh one-time
Total first-year: ₹26-51 lakh. ROI typically within 9-15 months from operational efficiency gains.
FAQ: Custom Retail Dashboards vs Off-the-Shelf BI
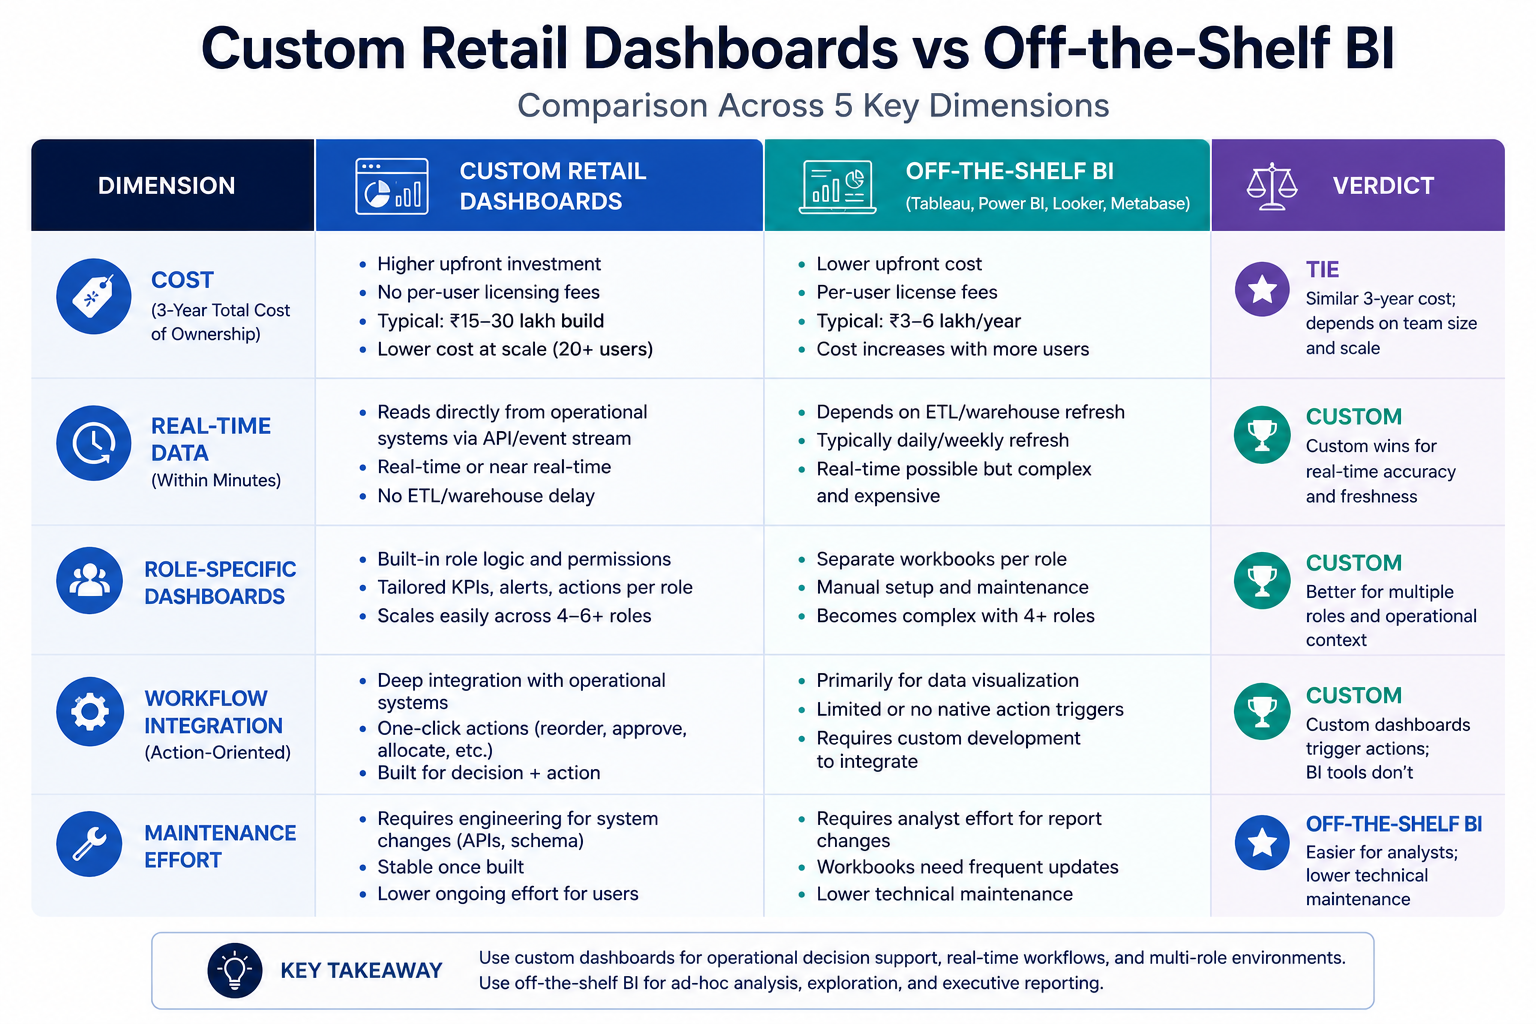
What's the cost difference between custom retail dashboards and Tableau/Power BI?
Custom dashboards have higher upfront build cost (₹15-30 lakh for a mid-market retailer) but no per-user licensing fees. Tableau/Power BI have lower upfront cost (₹3-6 lakh first-year license) but recurring costs and require additional data integration work for real-time use cases. Total 3-year cost is typically similar; the value differs based on use case fit.
What's the maintenance burden of a custom dashboard vs Tableau?
Custom dashboards need engineering attention when operational systems change (API updates, schema changes). Tableau workbooks need analyst attention when business questions evolve. For mid-market retailers with stable operational systems but evolving analytical needs, Tableau has lower maintenance burden. For retailers with evolving operations but stable reporting needs, custom has lower maintenance burden.
Can we switch from Tableau to a custom dashboard later, or is it a one-way door?
Not a one-way door. The investment to migrate is real — typically 8-12 weeks of build work — but the operational systems remain the same source of truth. We've migrated multiple clients from Tableau-only setups to hybrid architectures. The reverse migration (custom to Tableau-only) is rarer because once teams experience workflow-embedded dashboards, they don't want to give up the action triggers.
What about modern data stack tools (dbt, Snowflake, Looker) for mid-market retail?
The modern data stack is mature and powerful but typically over-engineered for mid-market retail (below ₹150 crore annual revenue). The dbt + Snowflake + Looker total cost runs ₹40-80 lakh per year all-in, with significant engineering team requirements. Most mid-market retailers get better ROI from a simpler unified operational platform + Power BI for one-offs.
Is AI-driven retail BI (Tableau Pulse, Power BI Copilot) changing this in 2026?
Yes, partially. AI-driven BI features make ad-hoc analysis faster — but they don't solve the workflow integration or real-time multi-source data problem. AI on top of fragmented data still produces confident-sounding wrong answers. The data plumbing has to be fixed first; AI is a multiplier on top of an accurate operational layer, not a replacement for one.
What To Do Next
For mid-market retail CFOs and CTOs evaluating dashboard architecture in 2026:
- Run the 3-question decision framework on your top 5 dashboard use cases
- Identify which use cases fit custom vs off-the-shelf vs hybrid
- DM "RETAIL DASHBOARD" on LinkedIn for our 1-page architecture brief
Need the right dashboard strategy? Let's talk.